- Original research
- Open access
- Published:
Genome-wide identification of cannabinoid biosynthesis genes in non-drug type Cannabis (Cannabis sativa L.) cultivar
Journal of Cannabis Research volume 6, Article number: 35 (2024)
Abstract
Background
Cannabis sativa cultivars can be classified as marijuana or hemp, depending on its amount of the psychoactive cannabinoid Δ9‐tetrahydrocannabinolic acid (THCA). Hemp Cheungsam is a non-drug type Cannabis sativa that is characterized by low THCA content. However, the transcripts and expression profile of cannabinoid biosynthesis pathway genes of hemp Cheungsam have not been investigated.
Methods
RNA-sequencing (RNA-seq) was performed on three different tissue types (flower, leaf, and stem) of hemp Cheungsam to understand their transcriptomes. The expression of cannabinoid biosynthesis pathway genes was further analyzed in each tissue type. Multiple sequence alignment and conserved domain analyses were used to investigate the homologs of cannbinoid biosynthesis genes.
Results
We found that the cannabinoid biosynthesis pathway was mainly expressed in the flowers of hemp Cheungsam, similar to other Cannabis cultivars. However, expression of cannabidiolic acid (CBDA) synthase was much higher than THCA synthase and cannabichromenic acid (CBCA) synthase, suggesting that the transcription profile favors CBDA biosynthesis. Sequence analysis of cannabinoid biosynthesis pathway genes suggested the identity of orthologs in hemp Cheungsam.
Conclusions
Cannabinoid biosynthesis in hemp Cheungsam mostly occurs in the flowers, compared to other plant organs. While CBDA synthase expression is high, THCA and CBCA synthase expression is considerably low, indicating lesser THCA biosynthesis and thus low THCA content. Sequence analysis of key genes (CBDA, THCA, and CBCA synthases) of the cannabinoid biosynthetic pathway indicates that orthologs are present in hemp Cheungsam.
Introduction
Cannabis is a widely cultivated plant with a long history dating back more than 6000 years (Atakan 2012; Tahir et al. 2021). The Cannabis genus is composed of three species (Cannabis sativa, Cannabis indica, and Cannabis ruderalis), with varying levels of specific cannabinoids [Cannabidiolic acid (CBDA), Δ9‐tetrahydrocannabinolic acid (THCA), and cannabichromenic acid (CBCA)] depending on the species and variety (Atakan 2012; Tahir et al. 2021). Furthermore, with extensive interbreeding between species, the chemical composition of a Cannabis plant cannot be easily determined based on its morphology alone (Tahir et al. 2021). Cannabis can be further classified into marijuana or hemp, depending on the amount of psychoactive cannabinoid THCA (Hilderbrand 2018; Hussain et al., 2021). As marijuana has a higher THCA content, it has been cultivated for use as a recreational and medicinal drug (Hussain et al., 2021). Hemp, which has lower THCA content, was cultivated for food and industrial purposes, including the production of hemp seeds and hemp oil, textiles, and even biodegradable plastics (Cerino et al. 2021; Hussain et al., 2021).
While C. sativa can produce more than 180 different cannabinoid compounds, the three most abundant cannabinoids, THCA, CBDA, and CBCA have been well documented (Tahir et al. 2021). The cannabinoid biosynthetic pathway stems from hexanoic acid, which is produced from the oxidative cleavage of other fatty acids (Gülck and Møller 2020). Hexanoic acid then undergoes a multistep conversion to olivetolic acid (OLA), which is one of two main substrates for cannabinoid biosynthesis (Gülck and Møller 2020; Tahir et al. 2021). The other substrate is geranyl pyrophosphate (GPP), a methylerythritol 4-phosphate (MEP) pathway intermediate that is formed by GPP synthase (GPS) catalyzing the condensation of dimethylallyl pyrophosphate and isopentenyl pyrophosphate (Gülck and Møller 2020; Tahir et al. 2021). Aromatic prenyltransferases (PT) catalyze the conversion of OLA and GPP to cannabigerolic acid (CBGA), which is further modified to other cannabinolic acids (CBDA, THCA, CBCA) by specific synthases (Gülck and Møller 2020; Tahir et al. 2021). CBDA, THCA, and CBCA can then undergo non-enzymatic decarboxylation to form cannabidiol, Δ9‐tetrahydrocannabinol, and cannabichromene (CBD, THC, and CBC), respectively (Tahir et al. 2021).
As the differentiation between marijuana and hemp is based on THCA content, a previous study has investigated THCA synthase polymorphisms (and thus the presence of active THCA synthase) as a main factor for identifying marijuana and hemp plants (Roman et al. 2022). However, this was not a completely accurate method for predicting THCA content in each tested cultivar (Roman et al. 2022). This can be possibly explained by a complex ancestry of interbreeding and introgression between Cannabis cultivars. Furthermore, gene duplication and deletion during the breeding process may have affected THCA production. In another study, the CBDRx cultivar was shown to be from a primary marijuana lineage but had a CBDA synthase (CBDAS) gene from hemp and no THCA synthase (THCAS) gene (Grassa et al. 2021).
Here, we investigated the transcriptome of non-drug type hemp “Cheungsam”, which is a hybrid between the local variety of Korean hemp and the IH3 hemp cultivar from the Netherlands (Moon et al. 2002). Hemp Cheungsam is a predominant hemp variety in Korea, as its lower THCA content makes it a preferrable C. sativa variety for Korean traditional medicine (Moon et al. 2002; Doh et al., 2019). Hemp Cheungsam samples were dissected into three different tissue types (flower, leaf, and stem) to better understand the transcriptome and cannabinoid biosynthetic pathway in various parts of the plant. We showed that similar to other Cannabis cultivars, cannabinoid biosynthesis genes in hemp Cheungsam were mostly expressed in the flowers. Multiple sequence alignment and conserved domain analyses also verified that the identified transcripts were mostly full-length homologs of the cannabinoid biosynthesis pathway genes.
Materials and methods
Plant growth conditions
Cannabis sativa L. seeds (Cheungsam) were soaked in 1% hydrogen peroxide solutions as liquid germination media. After one day, a fresh 1% H2O2 solution was added after the removal of the old solution. Seeds were soaked for three more days at room temperature again in the dark. Germinated seedlings were transplanted from the H2O2 solutions to soil and transferred to a growth chamber (26 ± 1 ℃, 16 h light:8 h dark cycle, 51% humidity, and light intensity of 258 µmol·m−2·sec−1). Hemp Cheungsam plants were grown in long day (LD) condition (16 h light:8 h dark) during the early stages of vegetative growth for up to 3 weeks. Subsequently, in the later vegetative growth stage, the light period was increased to 18 h light:6 h dark for another 8 to 10 weeks. To induce a transition to the reproductive stage, the photoperiod was reduced to 12 h light:12 h dark for approximately 5 weeks.
Extraction of RNA and RNA-sequencing (RNA-seq)
Branches of hemp Cheungsam with fully developed female flowers were harvested. All branches were immediately dissected after harvesting to obtain the leaf, stem, and flower samples. The developed cola with female flowers were collected as the flower sample. Palmate leaves from each branch were consolidated as the leaf sample. The stem sample comprised of the dissected branch without any leaf or flower tissue. All samples were flash frozen in liquid nitrogen, then ground into a fine powder for RNA extraction.
Total RNA was extracted from all samples and purified using RNeasy Plant Mini Kit (Qiagen, Germany) according to the manufacturer’s instructions, including the optional on-column DNase digestion step (Qiagen, Germany). The purity and concentration of total RNA were determined using a Nanodrop spectrophotometer (DS-11 spectrophotometer, DeNovix, USA). Only RNA samples with A260/280 ratios between 1.8 and 2.2, and A260/230 ratios higher than 2.0 were kept for RNA-seq. RNA-seq was performed by Macrogen (Korea) using the manufacturer's reagents and protocol.
The RNA-seq was performed with paired-end sequencing with 101 base pair (bp) read length. RNA library was constructed using TruSeq Stranded Total RNA Library Prep Plant Kit (Illumina, USA). The samples were sequenced using NovaSeq6000 system with flow cell type S4 (Illumina, USA) at Macrogen (Korea).
The raw sequence data of the RNA-seq was firstly subjected to a quality check using FastQC (version 0.11.7, Andrews 2010). After which, the adaptor sequences were trimmed via the Trimmomatic (version 0.38, Bolger et al. 2014). Bases at the rear ends with base quality < 3 were trimmed. In addition, sliding window trimming with window size = 4 was used to remove bases with mean quality < 15. Subsequently, the trimmed sequences that were < 36 bp were also removed from further analysis.
Trimmed reads were mapped to the Cannabis sativa reference genome cs10 (https://www.ncbi.nlm.nih.gov/datasets/genome/GCF_900626175.2/), using HISAT2 (version 2.1.0, Kim et al. 2019). Spliced read mapping was performed through Bowtie2 aligner (version 2.3.4.1, Langmead and Salzberg 2012). Transcript assembly onto the cs10 reference genome was done using StringTie (version 2.1.3b, Kovaka et al. 2019), to obtain the expression profile per sample.
Identification of differentially expressed genes (DEGs) and hierarchical clustering
Firstly, the transcriptome data was filtered to remove genes with FPKM < 1 for all samples. To calculate fold-change, 0.001 was added to all FPKM values. The average FPKM per tissue type was calculated and used to calculate gene expression fold-change between different plant tissues. DEGs were identified by fold-change > 2 or < 0.5 and Student’s t-test P-value < 0.05. Volcano plot for each pairwise comparison were generated using MATLAB version R2020a (The MathWorks Inc., USA).
DEGs identified from each pairwise comparison were plotted in a Venn diagram using the Interactivenn webtool (Heberle et al. 2015; http://www.interactivenn.net/). DEGs from the intersection of each Venn diagram were compiled and their respective FPKM values were plotted into a hierarchical clustering heatmap using MATLAB version R2020a (The MathWorks Inc., USA). Gene clusters identified from hierarchical clustering were used for further bioinformatics analysis.
Bioinformatics analysis for gene ontology (GO) terms and Kyoto Encyclopedia of Genes and Genomes (KEGG) pathways
Protein sequences associated with each DEG were used as the query for protein Basic Local Alignment Search Tool (BLASTP) searches, which were carried out locally using BLAST + (Camacho et al. 2009). BLASTP searches were against Arabidopsis protein sequences from the TAIR10 database (Lamesch et al., 2012). The output with the lowest e-value was chosen as the Arabidopsis best-fit ortholog of the hemp Cheungsam gene. Ortholog genes were filtered for e-value < 0.05 to remove results of low confidence.
The respective Arabidopsis ortholog genes were then used to identify GO terms and enriched KEGG pathways using the Database for Annotation, Visualization, and Integrated Discovery (DAVID) analysis (Huang et al. 2009; Sherman et al. 2022). GO term and KEGG pathway information were plotted in Excel.
Multiple sequence alignment and sequence analysis
Multiple sequence alignments and generation of phylogenetic trees were performed on MegAlign 15 (DNASTAR, Inc., USA). Alignment was carried out using the Clustal W tool on MegAlign 15. Protein domains were identified using Batch CD-Search (Marchler-Bauer and Bryant, 2004; Marchler-Bauer et al., 2011; https://www.ncbi.nlm.nih.gov/Structure/bwrpsb/bwrpsb.cgi) and MOTIF search tool (GenomeNet, https://www.genome.jp/tools/motif/). Prediction of PTS1 sequence in protein sequences was performed using the PTS1 predictor (Neuberger et al. 2003; https://mendel.imp.ac.at/pts1/). The C-terminal amino acid sequence (last 12 residues) of each protein sequence was used as the input for PTS1 prediction. Prediction of protein subcellular localization was carried out using WoLF PSORT (Horton et al., 2007; https://wolfpsort.hgc.jp/).
Results and discussion
Pedigree, significance, and morphology of hemp ‘Cheungsam’
Hemp Cheungsam is a variety of hemp (C. sativa) that originated from Korea (Moon et al. 2002). The variety was developed as a hybrid between the Korean local variety hemp and IH3 hemp from the Netherlands (Moon et al. 2002). As a predominant hemp variety in Korea, hemp Cheungsam has relatively low THCA is to CBDA content, resulting it to be a classified as a non-drug type Cannabis (Moon et al. 2002).
As the cultivation and consumption of Cannabis plants are highly regulated (Ransing et al. 2022), the development of Cannabis varieties is likely to be geographically restricted. Thus, in Korea, hemp Cheungsam is preferred over other local C. sativa varieties for its use in Korean traditional herbal medicine, due to its lower THCA content (Doh et al., 2019). The seeds and sprouts of hemp Cheungsam were also reported to contain compounds that are beneficial for human health such as Quercetin and Rutin, which have antioxidant and anti-inflammatory properties (Aloo et al., 2023a; Aloo et al., 2023b). Furthermore, CBDA from hemp Cheungsam has been used to enhance the anti-cancer activity of cabozantinib against hepatocellular carcinoma (Jeon et al. 2023).
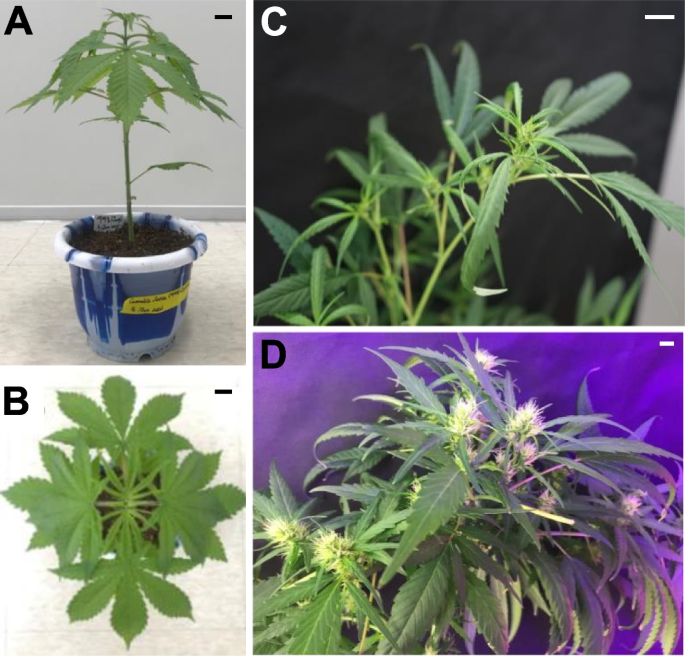
Hemp Cheungsam typically undergoes 10 to 13 weeks of vegetative growth. After which, the plant transitions to the flowering induction stage of 3 to 4 weeks. Hemp Cheungsam developed palmately compound leaves along its stem (Fig. 1A), which is similar to other varieties of C. sativa (Anderson and de la Paz 2021). Each compound leaf is made of green pinnate leaflets with serrated leaf margin (Fig. 1B). At the reproductive stage, hemp Cheungsam developed cola with female flowers, which started developing approximately 2 weeks after flower induction (Fig. 1C) and were fully developed at 5 weeks after flower induction (Fig. 1D).
Phenotype of hemp Cheungsam. A Hemp Cheungsam during the vegetative growth stage. B Top-down view of hemp Cheungsam, showing palmate leaves. C Female flowers developing at the cola at 2 w after flower induction. D Developed female flowers at the cola at 5 w after flower induction. Black (A, B) and white (C, D) scale bars, 1 cm
RNA-seq analysis of flower, leaf, and stem tissues of hemp Cheungsam
To understand the effects of gene transcription on its physiology and production of cannabinoids in different tissues of hemp Cheungsam, mature hemp plants with female flowers were dissected into flower, leaf, and stem tissues for RNA-seq analysis (Fig. 1). After removing adapter sequences and trimming low quality reads, all RNA-seq samples had more than 97% clean reads (Table 1). In addition, high Phred quality scores indicated high sequencing quality, as Q20 scores were above 97.8% and Q30 scores were above 93.3% in all samples (Table 1).
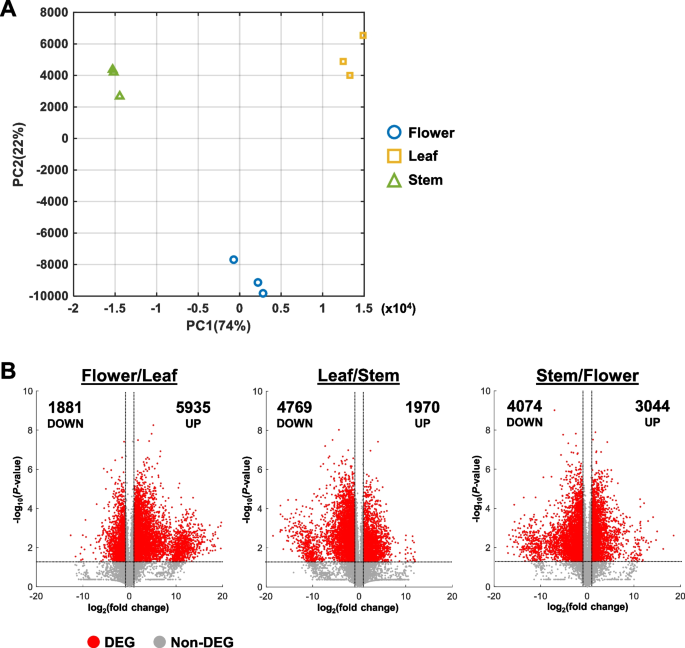
Reproducibility between replicates was verified by the Pearson correlation coefficient between samples (Fig. S1). Replicates of each tissue type showed a high correlation coefficient between replicates and a lower correlation between tissue types (Fig. S1). Similarly, samples from each tissue type formed distinct clusters in the PCA plot, suggesting that the transcriptomes of flower, leaf, and stem tissues differ greatly from each other (Fig. 2A). Furthermore, while all three tissue types varied in PC1, flower samples had distinct PC2 values from leaf and stem samples (Fig. 2A).
Comparison of transcriptomes between different tissue types. A Principal component analysis (PCA) plot of sample triplicates. PC1, principal component 1. PC2, Principal component 2. B Volcano plots for all sample comparisons. FPKM values were compared between two samples. Each volcano plot shows the distribution of fold change and Student’s t-test for all transcripts. Differentially expressed genes (DEGs) were identified with fold change > 2 or fold change < 0.5 and P-value < 0.05. Number of up- and down-regulated DEGs are indicated in each plot
Identification of differentially expressed genes (DEGs)
Genes with FPKM < 1 in all samples were excluded from further analysis due to their extremely low expression. To identify DEGs, pairwise comparison of FPKM values were carried out between the various plant tissues. DEGs were identified by filtering for genes with fold change > 2 or < 0.5 and P-value < 0.05 (Table S1). In addition, the fold change and P-value of all genes were visualized as volcano plots to better identify the transcriptomic differences between samples (Fig. 2B).
Interestingly, the most up-regulated DEGs were identified in the Flower/Leaf comparison with 5935 genes (Fig. 2B; Table 2). In comparison, the least up-regulated DEGs belonged to the Leaf/Stem comparison with 1970 genes (Fig. 2B; Table 2). In contrast, the most down-regulated DEGs were identified in the Leaf/Stem comparison with 4769 genes while the least down-regulated DEGs were from the Flower/Leaf comparison with 1881 genes (Fig. 2B; Table 2).
Identification of DEGs with specifically high- or low-expression in each plant tissue type
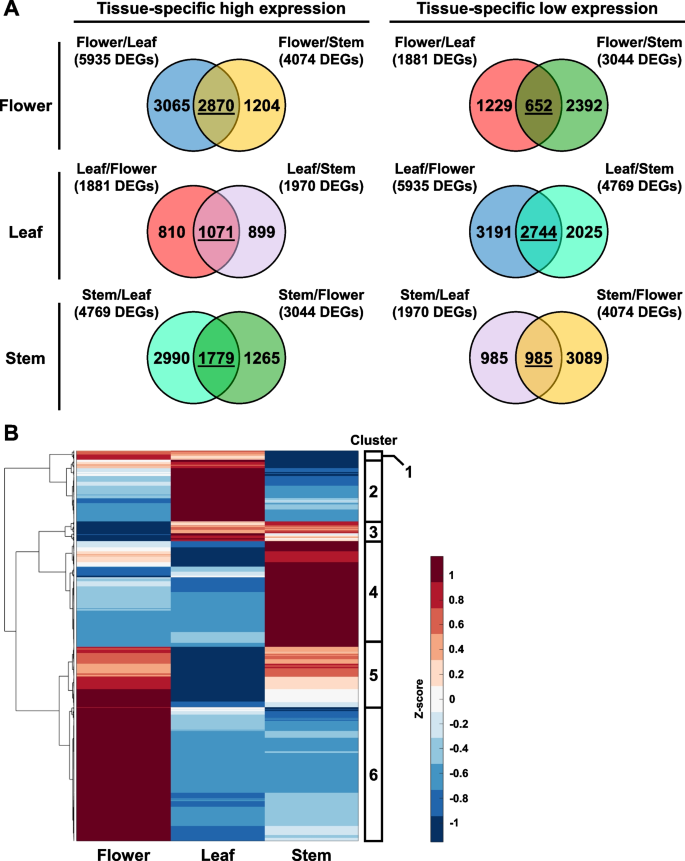
As there were three different hemp tissues in this analysis, pairwise comparisons would be unable to directly identify genes that are specifically induced or repressed in one specific tissue type. To address this limitation, the DEGs identified from each pairwise comparison were plotted into Venn diagrams. The shared DEGs in each Venn diagram represent genes that are specifically induced or repressed in each tissue type, as compared to the other plant tissues (Fig. 3A, Table S2). From this analysis, we found that flowers had the most DEGs with tissue-specific high expression and the least DEGs with tissue-specific low expression (Fig. 3A). On the other hand, leaf samples had the least DEGs with high expression and most DEGs with low expression (Fig. 3A). This corroborates with a previous study, which also showed that female Cannabis flowers have more up-regulated DEGs than other plant organs (Braich et al. 2019).
Identification of tissue-specific genes in hemp Cheungsam flower, leaf, and stem. A Venn diagrams show overlap of DEGs identified from all comparisons. DEGs shared between two comparisons are underlined. B Hierarchical clustering heatmap of shared DEGs, showing expression pattern of tissue-specific genes. Red color represents high expression while blue color represents low expression
The expression pattern of these tissue-specific DEGs was visualized in a hierarchical clustering heat map, which revealed six gene clusters (Fig. 3B, Table S3). Gene cluster 1 was enriched in the flower and leaf (Fig. 3B). Cluster 2 was specifically induced in leaf samples, while cluster 3 was up-regulated in both leaf and stem samples (Fig. 3B). Cluster 4 was enriched in only the stem, but cluster 5 was enriched in both flower and stem (Fig. 3B). Cluster 6 which is the largest gene cluster was highly expressed in only the flower samples (Fig. 3B). The highly expressed genes in flower samples may be attributed to the abundance of trichomes on female flowers, as a previous study showed overlapping expression profiles between female flowers and trichomes (Braich et al. 2019).
Tissue-specific enrichment of GO terms and KEGG pathways
Although our RNA-seq is aligned to the Cannabis sativa reference genome cs10 and other Cannabis reference genomes are available (van Bakel et al. 2011; Cai et al. 2021), GO term analysis of Cannabis genes is not readily available. As such, we performed a BLASTP search of each DEG’s protein sequence against the Arabidopsis TAIR10 database to identify close orthologs of each hemp Cheungsam gene. E-value < 0.05 was used to ensure high homology in identifying the Arabidopsis ortholog (Table S4). Identification of Arabidopsis orthologs was successful for most DEGs, as more than 85% of DEGs per gene cluster were mapped to an Arabidopsis ortholog (Table 3, Table S4). Furthermore, gene cluster 6 had the largest number of DEGs with no Arabidopsis orthologs (No Hit, Table 3), indicating that flower samples may express more genes that are unique to Cannabis.
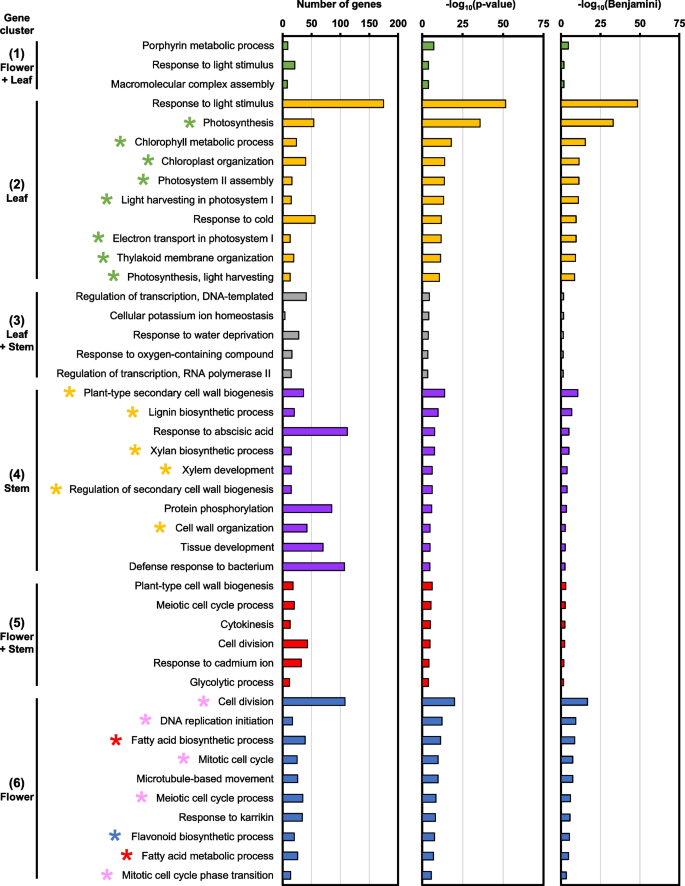
The Arabidopsis orthologs are subsequently used to identify biological process (BP) GO terms that are specifically induced in each gene cluster (Table S5). Gene cluster 2 consists of DEGs that were highly expressed in leaf samples, which corresponded with GO terms related to photosynthesis and chloroplasts, such as “photosynthesis” and “chlorophyll metabolic process” (green stars, Fig. 4). In contrast, gene cluster 4 comprises of DEGs with high expression in stem samples and were enriched in GO terms related to plant cell wall and vasculature development, including “plant-type secondary cell wall biogenesis” and “xylem development” (yellow stars, Fig. 4). Importantly, gene cluster 6 contains DEGs that were enriched in flowers and were related to GO terms involved in fatty acid biosynthesis and metabolism (red stars, Fig. 4). GO terms related to cell division were also identified in cluster 6, such as “meiotic cell cycle process” and “mitotic cell cycle” (pink stars, Fig. 4). Interestingly, the “flavonoid biosynthetic process” GO term was also found to be specific to flower samples (blue star, Fig. 4). While GO terms were also identified in gene clusters 1, 3, and 5, which were expressed in multiple tissue types, their enrichment was less significant (Fig. 4).
Enriched biological process (BP) GO terms in various plant tissue types. GO terms were selected to have Benjamini–Hochberg adjusted P-value (Benjamini) < 0.05. Top 10 GO terms are shown. Gene clusters correspond to Fig. 3B
Furthermore, the Arabidopsis orthologs were used to identify KEGG pathways from each gene cluster (Table S6). Leaf-specific DEGs in gene cluster 2 were associated with KEGG pathways related to photosynthesis like “photosynthesis – antenna proteins” and “carbon fixation in photosynthetic organisms” (green stars, Fig. S2). Interestingly, stem-specific DEGs in cluster 4 were related to “phenylpropanoid biosynthesis” and “stilbenoid, diarylheptanoid, and gingerol biosynthesis” (yellow stars, Fig. S2). DEGs in gene cluster 5, which were up-regulated in the flower and stem, were involved in amino acid metabolism such as “biosynthesis of amino acids” and “alanine, aspartate, and glutamate metabolism” (light blue stars, Fig. S2). Moreover, KEGG pathways related to “carbon metabolism” and “glycolysis/gluconeogenesis” were also identified in cluster 5 (pink stars, Fig. S2). Lastly, KEGG pathways that are specific to flower samples in gene cluster 6 were related to “fatty acid biosynthesis/metabolism” (red stars) as well as “flavonoid biosynthesis” (blue star, Fig. S2). Conversely, gene clusters 1 (up-regulated in flower and leaf) and 3 (up-regulated in leaf and stem) did not correlate to any biologically meaningful KEGG pathway (Fig. S2).
Analysis of cannabinoid biosynthetic pathway in each tissue type of hemp Cheungsam
While both GO term and KEGG pathway analyses identified fatty acid biosynthesis and metabolism to be specifically enriched in flowers of hemp Cheungsam, the analyses did not identify cannabinoid biosynthesis. This can be explained by the lack of Arabidopsis orthologs for cannabinoid biosynthetic pathway genes and the relative exclusivity of cannabinoid biosynthesis to a small number of organisms. While cannabinoid biosynthesis was initially thought to be specific to C. sativa, it is now known that other plants, such as Rhododendron dauricum and Radula marginata, also have cannabinoid biosynthetic pathway genes (Gülck and Møller 2020).
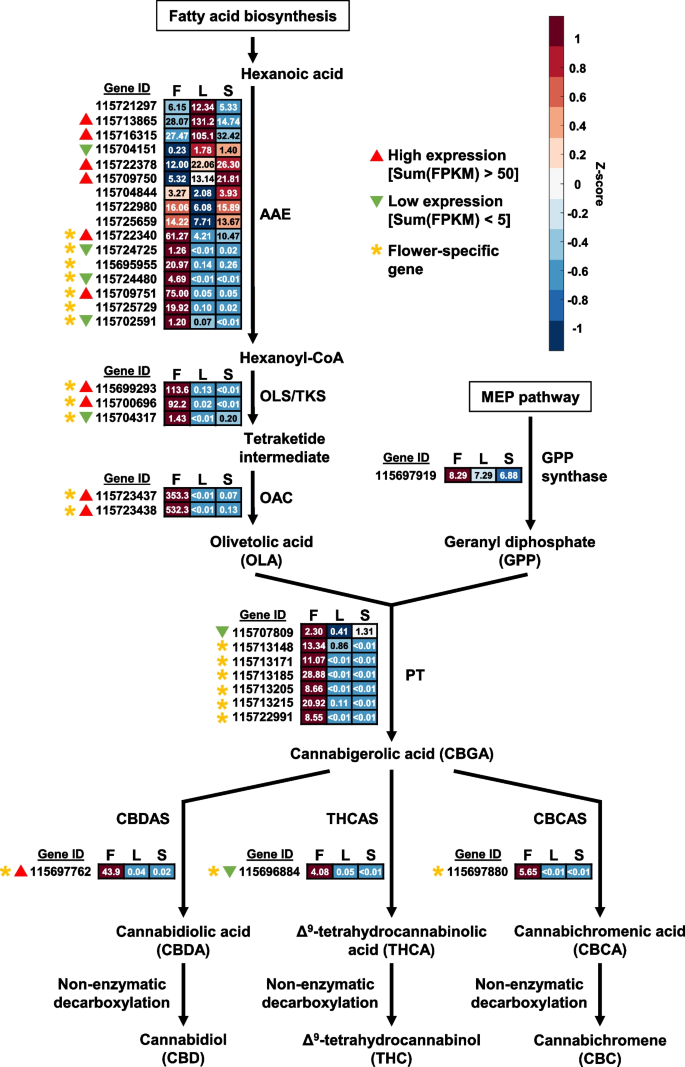
In hemp Cheungsam, many of the cannabinoid biosynthetic pathway genes were specifically expressed in the flowers (Fig. 5, Table S7). These include orthologs of genes encoding acyl-activating enzyme (AAE), olivetol synthase (OLS)/tetraketide synthase (TKS), olivetolic acid cyclase (OAC), and aromatic prenyltransferase (PT), which are responsible for generating the precursors for cannabinoid production (Fig. 5). Interestingly, 7 out of the 16 AAE orthologs in hemp Cheungsam were specifically expressed in the flowers as compared to other tissues (Fig. 5), indicating that these AAEs are crucial for cannabinoid biosynthesis. In contrast, the C. sativa marijuana cultivar Purple Kush displayed similar expression levels of AAE1 and AAE3 in stems, flowers, and other plant tissues (van Bakel et al. 2011). This suggests that gene expression patterns in hemp Cheungsam may differ from other varieties of C. sativa. The expression of all downstream genes OLS/TKS, OAC, PT, and CBDA/THCA/CBCA synthases (CBDAS, THCAS, and CBCAS) were highly specific to the flowers, indicating that cannabinoid biosynthesis occurs mostly in the flowers of hemp Cheungsam (Fig. 5). This is consistent with the transcriptome of C. sativa Purple Kush (van Bakel et al. 2011) and in agreement with the knowledge that cannabinoid biosynthesis predominantly occurs in the glandular trichomes of female flowers of Cannabis (Zager et al. 2019).
Expression of full-length cannabinoid biosynthetic pathway genes in various hemp Cheungsam plant tissues. Expression levels are represented by both Z-score and FPKM value. Red color indicates high Z-score while blue color indicates low Z-score. Each row represents a gene homolog. The number in each box represents FPKM value. Sum(FPKM) refers to total FPKM from flower, leaf, and stem samples. Flower-specific gene is defined as expression in flowers samples being more than five-fold than leaf or stem samples. AAE, ACYL-ACTIVATING ENZYME. OLS/TKS, OLIVETOL SYNTHASE/TETRAKETIDE SYNTHASE. OAC, OLIVETOLIC ACID CYCLASE. PT, AROMATIC PRENYLTRANSFERASE. CBDAS, CBDA synthase. THCAS, THCA synthase. CBCAS, CBCA synthase. F, flower. L, leaf. S, stem
While most cannabinoid biosynthetic pathway genes are specific to flowers, we noted that the overall expression levels may vary between orthologs. For example, OLS/TKS orthologs 115699293 and 115700696 have high FPKM values, while unigene 115704317 has low expression even in the flowers (Fig. 5). This suggests that unigenes 115699293 and 115700696 are likely to be the main OLS/TKS orthologs in hemp Cheungsam. By comparing the total FPKM value across all tissue types (flower, leaf, and stem), orthologs with high and low expression levels were identified (Fig. 5). Orthologs with high expression were found for AAE, OLS/TKS, and OAC, while GPS showed moderate expression (Fig. 5). In contrast, all 7 PT showed either moderate or low expression (Fig. 5). Downstream of CBGA, only the CBDAS ortholog showed high expression (Fig. 5). In contrast, the THCAS/CBCAS orthologs displayed moderate or low expression (Fig. 5). Taken together, this suggests that cannabinoid biosynthesis in hemp Cheungsam favors CBDA production over THCA and CBCA, which is consistent with a previous report showing high CBDA and low THCA content (Moon et al. 2002).
Analysis of cannabinoid biosynthetic pathway genes
Acyl-activating enzyme (AAE)
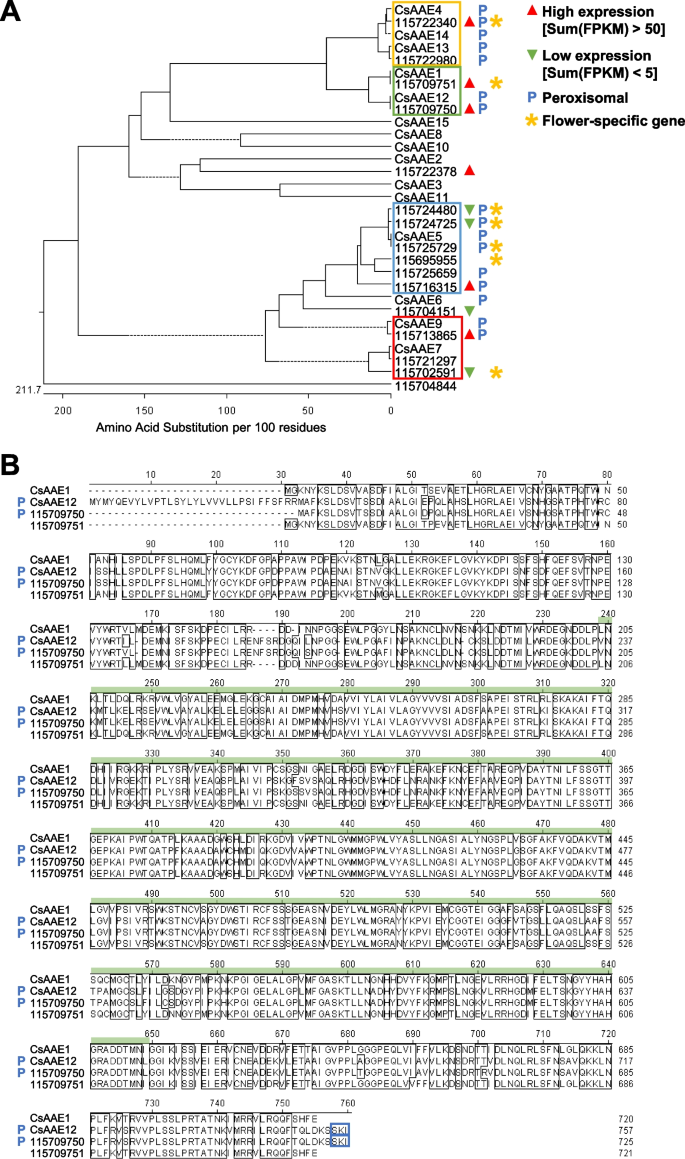
The synthesis of cannabinoids begins with the conversion of hexanoic acid to short-chain fatty acyl-coenzyme A (CoA) precursor hexanoyl-CoA by AAE (Stout et al. 2012). Hemp Cheungsam has 16 AAE gene orthologs, which showed high protein homology to known AAE genes from the GenBank database (Fig. 6A). Only unigene 115704844 was phylogenetically distant from the other AAE genes (Fig. 6A). CsAAE1 was previously suggested to be a hexanoyl-CoA synthase involved in the cannabinoid biosynthetic pathway, based on its high expression in glandular trichomes, hexanoyl-CoA synthase activity, and subcellular localization to the cytoplasm (Stout et al. 2012). As the subsequent step (polyketide biosynthesis) in the cannabinoid biosynthetic pathway occurs in the cytoplasm, AAEs that localize to the peroxisome are implied to be involved in peroxisomal β-oxidation (Shockey et al., 2003; De Azevedo Souza et al., 2008; Stout et al. 2012).
AAE orthologs in hemp Cheungsam. A Phylogenetic tree of hemp Cheungsam and GenBank database AAE protein sequences. Solid lines indicate actual phylogenetic distance. Dotted lines are used to align all terminals and do not represent phylogenetic distance. Colored boxes indicate four main groups of AAE identified in the phylogenetic tree. Sum(FPKM) refers to total FPKM from flower, leaf, and stem samples. B Multiple protein sequence alignment of CsAAE1 and CsAAE12 with hemp Cheungsam orthologs. Green bar, AMP-binding domain. Blue boxes highlight C-terminus peroxisome targeting signal type 1 (PTS1; Reumann 2004). Blue P indicates predicted peroxisomal AAE
As hemp Cheungsam unigene 115709751 showed high protein sequence similarity to CsAAE1, we performed multiple sequence alignment to compare their protein sequences with the nearest homologs CsAAE12 and unigene 115709750 (green box, Fig. 6A). Multiple sequence alignment revealed that CsAAE1, CsAAE12, 115709750, and 115709751 shared high homology in the AMP-binding domain (Fig. 6B), which is required to activate the carboxylic acid substrate (e.g. hexanoate) to form adenylate as an acyl-AMP intermediate (Shockey and Browse 2011). In addition to their high similarity, both CsAAE12 and 115709750 have the previously reported C-terminus peroxisome targeting signal type 1 (PTS1) sequence (blue boxes, Fig. 6B; Reumann 2004; Stout et al. 2012), suggesting that they localize to the peroxisome. In contrast, 115709751 does not and likely localizes to the cytoplasm, similar to CsAAE1 (Stout et al. 2012). The presence of PTS1 was further confirmed using the PTS1 predictor (Neuberger et al. 2003), while the subcellular localization was further verified using WoLF PSORT prediction (Horton et al., 2007).
We further analyzed the multiple sequence alignments amongst each group of AAE homologs (yellow, blue, red boxes, Fig. 6A). Multiple sequence alignments showed that the other AAE groups contain the AMP-binding domain and AMP-binding C-terminal domain (Fig. S3, S4, S5). The C-terminus PTS1 sequence and peroxisomal localization was also identified in CsAAE4, CsAAE13, CsAAE14, 115722340, and 115722980 (Fig. S3), which corroborates with a previous study showing CsAAE13 and CsAAE14 having the PTS1 sequence (Stout et al. 2012). As for homologs of CsAAE5, all homologs except 115695955 were predicted to contain the PTS1 sequence and localize to the peroxisome (Fig. S4). Lastly, the comparison between CsAAE7, CsAAE9, 115721297, 115702591, and 115713865 revealed that both CsAAE9 and 115713865 contain the PTS1 sequence for the peroxisome localization (Fig. S5). As for other AAE homologs, only CsAAE6 was predicted to have both PTS1 and peroxisomal localization (Fig. 6A). Taken together, the results imply that 115709751 is the major AAE ortholog in hemp Cheungsam, with high expression that is specific to the flowers and no predicted peroxisomal localization (Fig. 6A).
Olivetol synthase (OLS)/tetraketide synthase (TKS)
Hexanoyl-CoA undergoes sequential condensation with three malonyl-CoA, which is catalyzed by OLS/TKS to form a linear tetraketide intermediate followed by further conversion to OLA or olivetol depending on the presence or absence of OAC, respectively (Kearsey et al. 2020).
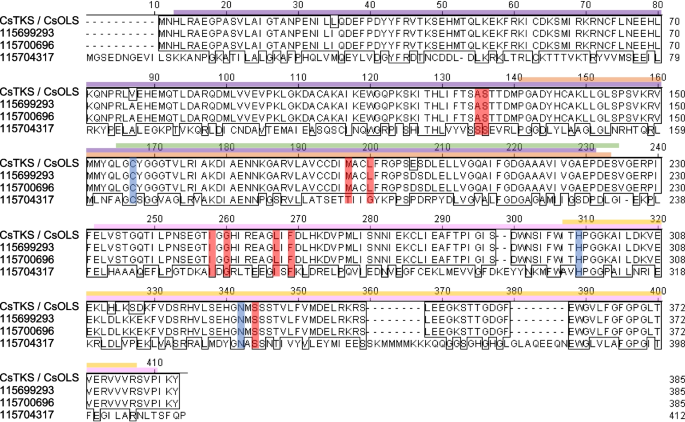
From the RNA-seq data set, we identified three putative OLS/TKS genes (unigenes 115699293, 115700696, and 115704317). Among them, 115699293 and 115700696 matched 100% to each other at the amino acid sequence level (Fig. 7), but not at nucleotide sequence level (Fig. S6), indicating two copies of this gene at different loci in hemp Cheungsam. These genes also showed 98.4% amino acid sequence similarity to the database OLS/TKS (CsTKS/CsOLS; Fig. 7). On the other hand, 115704317 showed low protein homology with these sequences, with 36.6% similarity to CsOLS and 37.3% similarity to 115699293 and 115700696.
OLS/TKS orthologs of hemp Cheungsam. A Multiple protein sequence alignment of CsOLS/CsTKS with hemp Cheungsam orthologs. Purple bar, Chalcone and stilbene synthase N-terminal domain. Pink bar, Chalcone and stilbene synthase C-terminal domain. Green bar, 3-Oxoacyl-[acyl-carrier-protein (ACP)] synthase III domain. Yellow bar, ACP synthase C-terminal domain. Orange bar, FAE1/Type III polyketide synthase-like domain. Based on Taura et al. (2009), CHS catalytic triad residues are highlighted in blue, while residues that may be important for substrate specificity or polyketide length are highlighted in red
Conserved domain search associated these OLS/TKS homologs with the chalcone synthase (CHS) superfamily, as N-terminal and C-terminal domains of chalcone and stilbene synthase were identified (Fig. 7). Moreover, other domains related to 3-oxoacyl-[acyl-carrier-protein (ACP)] synthase III and FAE1/Type III polyketide synthase-like protein were found in OLS/TKS homologs (Fig. 7). The identification of CHS-related domains found in OLS/TKS homologs can be explained by their high sequence similarity, as seen in the comparison between C. sativa OLS/TKS and Medicago sativa CHS (Taura et al. 2009). The comparison between CHS and OLS identified three conserved catalytic residues (Cys157, His297, Asn330; positions in CsOLS) for chain elongation and nine active site residues (Ala125, Ser126, Met187, Leu190, Ile248, Gly250, Leu257, Phe259, Ser332; positions in CsOLS) for substrate specificity (Fig. 7; Taura et al. 2009). All these residues were conserved in CsOLS as well as in unigenes 115699293 and 115700696 (Fig. 7), suggesting that 115699293 and 115700696 are OLS/TKS homologs in hemp Cheungsam. In contrast, the catalytic residues were conserved in 115704317 but 4 out of 9 substrate-specificity residues differ from CsOLS (Fig. 7). This suggests that while 115704317 may be catalytically similar to OLS, it likely functions as a polyketide synthase (PKS) that targets other substrates besides hexanoyl-CoA and produces polyketides of different length (Jez et al. 2000).
Olivetolic acid cyclase (OAC)
The linear tetraketide intermediate is further cyclized by OAC to produce OLA (Kearsey et al. 2020). Here, we identified two OAC orthologs (unigenes 115723437, 115723438) that matched 100% to the GenBank database CsOAC protein sequence (Fig. S7A). Interestingly, the nucleotide sequences of both hemp OAC homologs showed slight differences from the GenBank database nucleotide sequence (Fig. S7B). This suggests that hemp Cheungsam may have a single OAC gene with multiple transcript variants or two highly conserved genes.
CsOAC, 115723437, and 115723438 contain the stress-responsive dimeric α + β barrel (DABB) domain (Fig. S7), which makes them structurally similar to other polyketide cyclases (Gagne et al. 2012). Enzymatic assay of DABB domain-containing OAC from C. sativa trichomes showed the conversion of hexanoyl-CoA to OLA, in the presence of OLS/TKS (Gagne et al. 2012). This indicates that the conserved DABB domain plays a significant role for OLA production.
Aromatic prenyltransferase (PT)
OLA reacts with GPP to undergo prenylation by PT, resulting in the biosynthesis of CBGA (Blatt-Janmaat and Qu 2021). The RNA-seq elucidated 7 putative PT in hemp Cheungsam. In C. sativa, CsPT1 and CsPT4 were previously identified to be key players in the biosynthesis of CBGA from OLA and GPP (Lim et al. 2021). In contrast, CsPT2 was categorised as a clade II PT, which was shown to be involved in tocopherol biosynthesis (Collakova and DellaPenna, 2001, Rea et al. 2019). Moreover, while CsPT3 belonged to the same phylogenetic clade as CsPT1 and CsPT4, it was demonstrated to function in Cannflavin A and B biosynthesis in C. sativa (Rea et al. 2019).
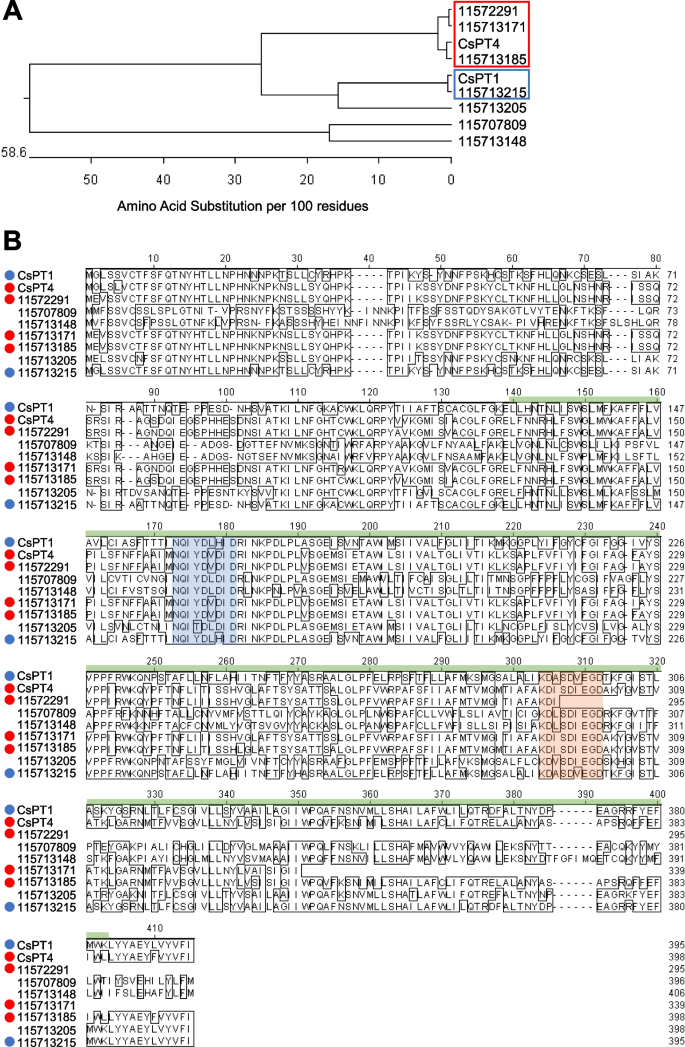
Phylogenetic analysis of hemp Cheungsam PT orthologs against GenBank database CsPT1 and CsPT4 revealed high protein similarity between CsPT1 with unigene 115713215 (blue box, Fig. 8A). In addition, CsPT4 formed a distinct clade with unigenes 115722991, 115713171, and 115713185 (red box, Fig. 8A).
PT orthologs in hemp Cheungsam. A Phylogenetic tree of protein sequences of CsPT1, CsPT4, and hemp Cheungsam PT orthologs. Red and blue boxes indicate close orthologs of CsPT4 and CsPT1, respectively. B Multiple sequence alignment of all sequences in (A). Highlighted sequences are conserved PT motifs: NQxxDxxxD (blue), KDxxDxxGD (orange) (de Bruijn et al. 2020). Green bar, UbiA domain. CsPT1 ortholog, blue circle. CsPT4 ortholog, red circle
Further sequence alignment was carried out for CsPT1, CsPT4, and all PT orthologs, which indicated a generally conserved UbiA prenyltransferase domain in CsPT1, CsPT4, and all high similarity orthologs (red and blue dots, Fig. 8B). The UbiA superfamily proteins are characterized as intramembrane PT that function in various biological functions such as chlorophyll biosynthesis, tocopherol biosynthesis, and secondary metabolism to produce phytoalexins and alkaloids for plant defense (Li 2016). CsPTs, which are homogentisate (HG) PTs, typically contain the conserved aspartate-rich motifs, NQxxDxxxD and KDxxDxxGD (de Bruijn et al. 2020). Interestingly, all putative PT genes in hemp Cheungsam contain the NQxxDxxxD motif (blue region, Fig. 8), but the KDxxDxxGD motif was missing from 115722991 (orange region, Fig. 8). These motifs function in regulating Mg2+ ions that stabilize the pyrophosphate component of prenyl donors for further reaction (de Bruijn et al. 2020). Also, PTs from the HG family have been shown to localize in the plastids (Sukumaran et al. 2018; Yang et al. 2018). As unigenes 115713171, 115713185, and 115713215 (Fig. 8) have high homology with CsPT1/4 and contain the conserved aspartate-rich motifs, it is possible that they are functional aromatic PTs that catalyze the conversion of OLA to CBGA in hemp Cheungsam.
Cannabinoid oxidocyclase (CBCAS, CBDAS, THCAS)
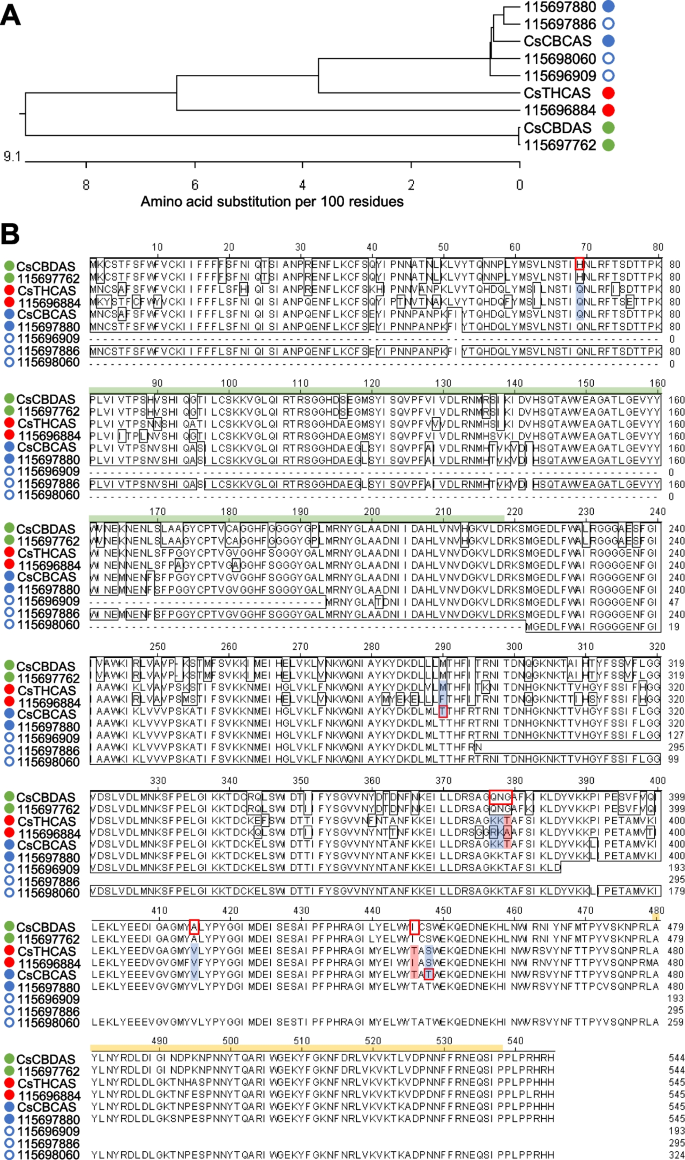
CBCAS, CBDAS, and THCAS are cannabinoid oxidocyclases that use CBGA as a substrate for the conversion to CBCA, CBDA and THCA (Jalali et al. 2019; Melzer et al. 2022). The RNA-seq data set has elucidated the following putative genes: four CBCAS, one THCAS, and one CBDAS (Fig. 9A). Multiple sequence alignment of the protein sequences showed that GenBank CsCBCAS shared high protein homology with unigenes 115696909, 115697880, 115697886, and 115698060 (Fig. 9B). Moreover, CsCBDAS matched 100% to unigene 115697762 (Fig. 9A, B). As unigene 115696884 showed high similarity to both CsCBCAS (87.9%) and CsTHCAS (89.0%) (Fig. 9A), further sequence analysis was needed to elucidate its function and identity.
Cannabinoid oxidocyclase orthologs of hemp Cheungsam. A Phylogenetic tree of protein sequences of CsCBCAS, CsCBDAS, and CsTHCAS with orthologs. B Multiple sequence alignment of all sequences in (A). Green bar, FAD-binding domain. Yellow bar, BBE-like domain. Blue circle, CBCAS homolog. Green circle, CBDAS homolog. Red circle, THCAS homolog. Closed circles represent full-length sequences with stop codons. Open circles represent partial sequences
CBDAS, THCAS, and CBCAS are known to belong to the Berberine Bridge Enzyme (BBE)-like gene family (Sirikantaramas et al. 2004). CBDAS, THCAS, and CBCAS also feature conserved domains of the BBE-like family, including the Flavin Adenin Dinucleotide (FAD) binding domain and a C-terminal BBE-like domain (Fig. 9B; van Velzen and Schranz, 2021). These two main domains (FAD-binding domain and BBE-like domain) were found in most of cannabinoid oxidocyclase orthologs of hemp Cheungsam (Fig. 9B). However, N-terminal truncation resulted in unigenes 115696909 and 115698060 lacking the FAD-binding domain, while C-terminal truncation resulted in unigenes 115696909 and 115697886 lacking the BBE-like domain (Fig. 9B), suggesting that these unigenes are partial sequences and do not correspond to functional cannabinoid oxidocyclases. All other hemp Cheungsam cannabinoid oxidocyclase sequences were highly conserved with CBDAS, THCAS, or CBDAS, suggesting that they are full-length oxidocyclases (Fig. 9B). However, it is important to note that expression of the full-length oxidocyclase homologs were different, as unigene 115697762 (CBDAS homolog) showed more than seven-fold higher expression than unigenes 115696884 (THCAS homolog) and 115697880 (CBCAS homolog) (Fig. 5). This was consistent with the high CBDA and low THCA content of hemp Cheungsam (Moon et al. 2002).
To elucidate the identity of 115696884, we compared specific amino acid residues at the shared active site between CsCBDAS, CsTHCAS, and CsCBCAS as identified by Lim et al. (2021). While CsCBDAS, CsTHCAS, and CsCBCAS share a generally similar amino acid sequence, specific residues at the active site may be used to differentiate between the cannabinoid oxidocyclases (red boxes, Fig. 9B; Lim et al. 2021). The multiple sequence alignment indicated that these amino acid residues in 115696884 were mostly similar to CsTHCAS, including exact matches at Gln69, Lys378, Val415, and Ser448 (blue highlights, Fig. 9B). Other residue changes in 115696884 were of similar chemical properties as CsTHCAS: Phe290 (115696884) was non-polar like Met290 (CsTHCAS), while Arg377 (115696884) had a positively charged side chain like Lys377 (CsTHCAS) (blue highlights, Fig. 9B). Besides these, 115696884 had two other residue changes that did not match CsTHCAS: Ala379 to Thr379 and Ile446 to Thr446 (red highlights, Fig. 9B). In contrast, 115696884 had three mismatches to CsCBCAS: Phe290 to Thr290, Ala379 to Thr379, and Ile446 to Thr446 (Fig. 9B). These amino acid differences suggest that unigene 115696884 may function more closely to CsTHCAS. Furthermore, the small but detectable amount of THCA in hemp Cheungsam (0.34%, Moon et al. 2002) suggests that unigene 115696884, despite its relatively low expression in flowers (Fig. 5), may be a functional but low-activity THCAS. However, further work is required to investigate if unigene 115696884 functions as a THCAS or other cannabinoid oxidocyclase.
Conclusion
All in all, the transcriptome analyses have shown that hemp Cheungsam expressed most cannabinoid biosynthetic pathway genes specifically in its flowers, similar to other Cannabis cultivars. Further investigation of each gene’s expression level suggests preferential biosynthesis of CBDA, compared to THCA and CBCA production. Moreover, sequence analysis elucidated key orthologs for each gene of the cannabinoid biosynthetic pathway in hemp Cheungsam.
Availability of data and materials
The data analyzed in this study are available from the corresponding authors with a reasonable request.
Abbreviations
- AAE:
-
Acyl-activating enzyme
- BLAST:
-
Basic Local Alignment Search Tool
- BP:
-
Biological process
- CBC:
-
Cannabichromene
- CBCA:
-
Cannabichromenic acid
- CBCAS:
-
CBCA synthase
- CBD:
-
Cannabidiol
- CBDA:
-
Cannabidiolic acid
- CBDAS:
-
CBDA synthase
- CBGA:
-
Cannabigerolic acid
- DAVID analysis:
-
Database for Annotation, Visualization, and Integrated Discovery analysis
- DEG:
-
Differentially expressed genes
- FPKM:
-
Fragments per kilobase of transcript per million mapped reads
- GO:
-
Gene ontology
- GPP:
-
Geranyl pyrophosphate
- GPS:
-
GPP synthase
- KEGG:
-
Kyoto Encyclopedia of Genes and Genomes
- MEP:
-
Methylerythritol 4-phosphate
- OAC:
-
Olivetolic acid cyclase
- OLA:
-
Olivetolic acid
- OLS:
-
Olivetol synthase
- PT:
-
Aromatic prenyltransferases
- RNA-seq:
-
RNA-sequencing
- THC:
-
Δ9‐Tetrahydrocannabinol
- THCA:
-
Δ9-Tetrahydrocannabinolic acid
- THCAS:
-
THCA synthase
- TKS:
-
Tetraketide synthase
References
Aloo SO, Park S, Oh D-H. Impacts of germination and lactic acid bacteria fermentation on anti-nutrients, bioactive compounds, and selected functional properties of industrial hempseed (Cannabis sativa L.). Food Chem. 2023a;428.
Aloo SO, Kwame FO, Oh D-H. Identification of possible bioactive compounds and a comparative study on in vitro biological properties of whole hemp seed and stem. Food Biosci. 2023b;51: 102329.
Anderson PJ, de la Paz A. How to identify hemp, Cannabis sativa L. (and lookalike) plants. Florida Department of Agriculture and Consumer Services Circular 43. 2021. https://www.fdacs.gov/ezs3download/download/96962/2651285/Media/Files/Plant-Industry-Files/CIRCULAR-Hemp-01945.pdf. Accessed 25 May 2023.
Andrews S. FastQC: a quality control tool for high throughput sequence data. 2010. http://www.bioinformatics.babraham.ac.uk/projects/fastqc/. Accessed 14 Mar 2022.
Atakan Z. Cannabis, a complex plant: different compounds and different effects on individuals. Ther Adv Psychopharmacol. 2012;2:241–54.
Blatt-Janmaat K, Qu Y. The biochemistry of phytocannabinoids and metabolic engineering of their production in heterologous systems. Int J Mol Sci. 2021;22:2454.
Bolger AM, Lohse M, Usadel B. Trimmomatic: a flexible trimmer for Illumina sequence data. Bioinformatics. 2014;30:2114–20.
Braich S, Baillie RC, Jewell LS, Spangenberg GC, Cogan NOI. Generation of a comprehensive transcriptome atlas and transcriptome dynamics in medicinal Cannabis. Sci Rep. 2019;9:16583.
Cai S, Zhang Z, Huang S, Bai X, Huang Z, Zhang YJ, Huang L, Tang W, Haughn G, You S, Liu Y. CannabisGDB: a comprehensive genomic database for Cannabis Sativa L. Plant Biotechnol J. 2021;19:857–9.
Camacho C, Coulouris G, Avagyan V, Ma N, Papadopoulos J, Bealer K, Madden TL. BLAST+: architecture and applications. BMC Bioinformatics. 2009;10:421.
Cerino P, Buonerba C, Cannazza G, D’Auria J, Ottoni E, Fulgione A, Di Stasio A, Pierri B, Gallo A. A review of hemp as food and nutritional supplement. Cannabis Cannabinoid Res. 2021;6:19–27.
Collakova E, DellaPenna D. Isolation and functional analysis of homogentisate phytyltransferase from Synechocystis sp. PCC 6803 and Arabidopsis. Plant Physiol. 2001;127:1113–24.
da Huang W, Sherman BT, Lempicki RA. Systematic and integrative analysis of large gene lists using DAVID bioinformatics resources. Nat Protoc. 2009;4:44–57.
De Azevedo SC, Barbazuk B, Ralph SG, Bohlmann J, Hamberger B, Douglas CJ. Genome-wide analysis of a land plant-specific acyl:coenzyme A synthetase (ACS) gene family in Arabidopsis, poplar, rice and Physcomitrella. New Phytol. 2008;179:987–1003.
de Bruijn WJC, Levisson M, Beekwilder J, van Berkel WJH, Vincken JP. Plant aromatic prenyltransferases: tools for microbial cell factories. Trends Biotechnol. 2020;38:917–34.
Doh EJ, Lee G, Yun YJ, Kang LW, Kim ES, Lee MY, Oh SE. DNA markers to discriminate Cannabis sativa L. “Cheungsam” with low tetrahydrocannabinol (THC) content from other South Korea cultivars based on the nucleotide sequences of tetrahydrocannabinolic acid synthase and putative 3-ketoacyl-coa synthase genes. Evid Based Complement Alternat Med. 2019;2019:8121796.
Gagne SJ, Stout JM, Liu E, Boubakir Z, Clark SM, Page JE. Identification of olivetolic acid cyclase from Cannabis sativa reveals a unique catalytic route to plant polyketides. Proc Natl Acad Sci U S A. 2012;109:12811–6.
Grassa CJ, Weiblen GD, Wenger JP, Dabney C, Poplawski SG, Motley ST, Michael TP, Schwartz CJ. A new Cannabis genome assembly associates elevated cannabidiol (CBD) with hemp introgressed into marijuana. New Phytol. 2021;230:1665–79.
Gülck T, Møller BL. Phytocannabinoids: origins and biosynthesis. Trends Plant Sci. 2020;25:985–1004.
Heberle H, Meirelles GV, da Silva FR, Telles GP, Minghim R. InteractiVenn: a web-based tool for the analysis of sets through Venn diagrams. BMC Bioinformatics. 2015;16:169.
Hilderbrand RL. Hemp & cannabidiol: what is a medicine? Mo Med. 2018;115:306–9.
Horton P, Park KJ, Obayashi T, Fujita N, Harada H, Adams-Collier CJ, Nakai K. WoLF PSORT: protein localization predictor. Nucleic Acids Res. 2007;35(Web Server issue):W585–587.
Hussain T, Jeena G, Pitakbut T, Vasilev N, Kayser O. Cannabis sativa research trends, challenges, and new-age perspectives. iScience. 2021;24:103391.
Jalali S, Salami SA, Sharifi M, Sohrabi S. Signaling compounds elicit expression of key genes in cannabinoid pathway and related metabolites in cannabis. Ind Crops Prod. 2019;133:105–10.
Jeon Y, Kim T, Kwon H, Kim JK, Park YT, Ham J, Kim YJ. Cannabidiol enhances cabozantinib-induced apoptotic cell death via phosphorylation of p53 regulated by ER stress in hepatocellular carcinoma. Cancers (basel). 2023;15:3987.
Jez JM, Austin MB, Ferrer J, Bowman ME, Schröder J, Noel JP. Structural control of polyketide formation in plant-specific polyketide synthases. Chem Biol. 2000;7:919–30.
Kearsey LJ, Prandi N, Karuppiah V, Yan C, Leys D, Toogood H, Takano E, Scrutton NS. Structure of the Cannabis sativa olivetol-producing enzyme reveals cyclization plasticity in type III polyketide synthases. FEBS J. 2020;287:1511–24.
Kim D, Paggi JM, Park C, Bennett C, Salzberg SL. Graph-based genome alignment and genotyping with HISAT2 and HISAT-genotype. Nat Biotechnol. 2019;37:907–15.
Kovaka S, Zimin AV, Pertea GM, Razaghi R, Salzberg SL, Pertea M. Transcriptome assembly from long-read RNA-seq alignments with StringTie2. Genome Biol. 2019;20:278.
Lamesch P, Berardini TZ, Li D, Swarbreck D, Wilks C, Sasidharan R, Muller R, Dreher K, Alexander DL, Garcia-Hernandez M, Karthikeyan AS, Lee CH, Nelson WD, Ploetz L, Singh S, Wensel A, Huala E. The Arabidopsis Information Resource (TAIR): improved gene annotation and new tools. Nucleic Acids Res. 2012;40(Database issue):D1202–1210.
Langmead B, Salzberg SL. Fast gapped-read alignment with Bowtie 2. Nat Methods. 2012;9:357–9.
Li W. Bringing bioactive compounds into membranes: the UbiA superfamily of intramembrane aromatic prenyltransferases. Trends Biochem Sci. 2016;41:356–70.
Lim KJH, Lim YP, Hartono YD, Go MK, Fan H, Yew WS. Biosynthesis of nature-inspired unnatural cannabinoids. Molecules. 2021;26:2914.
Marchler-Bauer A, Bryant SH. CD-Search: protein domain annotations on the fly. Nucleic Acids Res. 2004;32(Web Server issue):W327–331.
Marchler-Bauer A, Lu S, Anderson JB, Chitsaz F, Derbyshire MK, DeWeese-Scott C, Fong JH, Geer LY, Geer RC, Gonzales NR, Gwadz M, Hurwitz DI, Jackson JD, Ke Z, Lanczycki CJ, Lu F, Marchler GH, Mullokandov M, Omelchenko MV, Robertson CL, Song JS, Thanki N, Yamashita RA, Zhang D, Zhang N, Zheng C, Bryant SH. CDD: a Conserved Domain Database for the functional annotation of proteins. Nucleic Acids Res. 2011;39(Database issue):D225–229.
Melzer R, McCabe PF, Schilling S. Evolution, genetics and biochemistry of plant cannabinoid synthesis: a challenge for biotechnology in the years ahead. Curr Opin Biotechnol. 2022;75: 102684.
Moon Y-H, Lee B-H, Jeong B-C, Kim Y-U, Kim G-Y. Breeding history of non-drug type hemp variety “Cheungsam” and it’s characteristics. Korean J Int Agric. 2002;14:119–26.
Neuberger G, Maurer-Stroh S, Eisenhaber B, Hartig A, Eisenhaber F. Prediction of peroxisomal targeting signal 1 containing proteins from amino acid sequence. J Mol Biol. 2003;328:581–92.
Ransing R, de la Rosa PA, Pereira-Sanchez V, Handuleh JIM, Jerotic S, Gupta AK, Karaliuniene R, de Filippis R, Peyron E, Sönmez Güngör E, Boujraf S, Yee A, Vahdani B, Shoib S, Stowe MJ, Jaguga F, Dannatt L, da Silva AK, Grandinetti P, Jatchavala C. Current state of cannabis use, policies, and research across sixteen countries: cross-country comparisons and international perspectives. Trends Psychiatry Psychother. 2022;44(Suppl 1): e20210263.
Rea KA, Casaretto JA, Al-Abdul-Wahid MS, Sukumaran A, Geddes-McAlister J, Rothstein SJ, Akhtar TA. Biosynthesis of cannflavins A and B from Cannabis sativa L. Phytochemistry. 2019;164:162–71.
Reumann S. Specification of the peroxisome targeting signals type 1 and type 2 of plant peroxisomes by bioinformatics analyses. Plant Physiol. 2004;135:783–800.
Roman MG, Cheng YC, Kerrigan S, Houston R. Evaluation of tetrahydrocannabinolic acid (THCA) synthase polymorphisms for distinguishing between marijuana and hemp. J Forensic Sci. 2022;67:1370–81.
Sherman BT, Hao M, Qiu J, Jiao X, Baseler MW, Lane HC, Imamichi T, Chang W. DAVID: a web server for functional enrichment analysis and functional annotation of gene lists (2021 update). Nucleic Acids Res. 2022;50(W1):W216–221.
Shockey J, Browse J. Genome-level and biochemical diversity of the acyl-activating enzyme superfamily in plants. Plant J. 2011;66:143–60.
Shockey JM, Fulda MS, Browse J. Arabidopsis contains a large superfamily of acyl-activating enzymes. Phylogenetic and biochemical analysis reveals a new class of acyl-coenzyme a synthetases. Plant Physiol. 2003;132:1065–76.
Sirikantaramas S, Morimoto S, Shoyama Y, Ishikawa Y, Wada Y, Shoyama Y, Taura F. The gene controlling marijuana psychoactivity: molecular cloning and heterologous expression of Δ1-tetrahydrocannabinolic acid synthase from Cannabis sativa L. J Biol Chem. 2004;279:39767–74.
Stout JM, Boubakir Z, Ambrose SJ, Purves RW, Page JE. The hexanoyl-CoA precursor for cannabinoid biosynthesis is formed by an acyl-activating enzyme in Cannabis sativa trichomes. Plant J. 2012;71:353–65.
Sukumaran A, McDowell T, Chen L, Renaud J, Dhaubhadel S. Isoflavonoid-specific prenyltransferase gene family in soybean: GmPT01, a pterocarpan 2-dimethylallyltransferase involved in glyceollin biosynthesis. Plant J. 2018;96:966–81.
Tahir MN, Shahbazi F, Rondeau-Gagné S, Trant JF. The biosynthesis of the cannabinoids. J Cannabis Res. 2021;3:7.
Taura F, Tanaka S, Taguchi C, Fukamizu T, Tanaka H, Shoyama Y, Morimoto S. Characterization of olivetol synthase, a polyketide synthase putatively involved in cannabinoid biosynthetic pathway. FEBS Lett. 2009;583:2061–6.
van Velzen R, Schranz ME. Origin and evolution of the cannabinoid oxidocyclase gene family. Genome Biol Evol. 2021;13:evab130.
van Bakel H, Stout JM, Cote AG, Tallon CM, Sharpe AG, Hughes TR, Page JE. The draft genome and transcriptome of Cannabis sativa. Genome Biol. 2011;12:R102.
Yang T, Fang L, Sanders S, Jayanthi S, Rajan G, Podicheti R, Thallapuranam SK, Mockaitis K, Medina-Bolivar F. Stilbenoid prenyltransferases define key steps in the diversification of peanut phytoalexins. J Biol Chem. 2018;293:28–46.
Zager JJ, Lange I, Srividya N, Smith A, Lange BM. Gene networks underlying cannabinoid and terpenoid accumulation in Cannabis. Plant Physiol. 2019;180:1877–97.
Acknowledgements
We thank Jay Hemp Korea for supplying hemp Cheungsam analyzed in this study.
Funding
This research was supported by the National Research Foundation, Prime Minister’s Office, Singapore under its Synthetic Biology Research and Development Programme (Award No: SBP-P3) and Temasek Life Sciences Laboratory (TLL) to SR and ICJ, and grants from the Korea Research Institute of Bioscience and Biotechnology (KRIBB) Research Initiative Program (KGM5282223, KGM5382212, and JHM0082111) to CYK.
Author information
Authors and Affiliations
Contributions
CYK and ICJ conceived and supervised the overall project. BJRS, YJJ, SR, CYK, and ICJ designed the experiments. YJJ, JCJ, JL, and CYK performed molecular experiments for RNA-seq. BJRS, SHL, and ICJ analyzed RNA-seq and processed the biological implications of the RNA-seq data. BJRS, SHL and ICJ drafted the manuscript. All authors contributed to the preparation of the manuscript. The authors read and approved the final manuscript.
Corresponding authors
Ethics declarations
Ethics approval and consent to participate
Not applicable.
Consent for publication
Not applicable.
Competing interests
The authors declare that they have no competing interests.
Additional information
Publisher’s Note
Springer Nature remains neutral with regard to jurisdictional claims in published maps and institutional affiliations.
Supplementary Information
42238_2024_246_MOESM1_ESM.xlsx
Supplementary Material 1: Supplementary Table S1. List of DEGs identified from each pairwise comparison of plant tissues (flower, leaf, stem) of hemp Cheungsam.
42238_2024_246_MOESM7_ESM.xlsx
Supplementary Material 7: Supplementary Table S7. Average FPKM of cannabinoid biosynthesis pathway genes in various plant tissues (flower, leaf, stem).
42238_2024_246_MOESM8_ESM.pptx
Supplementary Material 8: Supplementary Figure S1. Heatmap of square of Pearson correlation coefficient. Supplementary Figure S2. KEGG pathway analysis. KEGG pathway terms were selected to have Benjamini–Hochberg adjusted P-value (Benjamini) < 0.05. Top 10 KEGG pathway terms are shown. Gene clusters correspond to Fig. 3B. Supplementary Figure S3. Multiple protein sequence alignment of CsAAE4, CsAAE13, and CsAAE14 with hemp Cheungsam orthologs. Green bar, AMP-binding domain. Yellow bar, AMP-binding C-terminal domain. Blue P indicates predicted peroxisomal AAE. Supplementary Figure S4. Multiple protein sequence alignment of CsAAE5 with hemp Cheungsam orthologs. Green bar, AMP-binding domain. Yellow bar, AMP-binding C-terminal domain. Blue P indicates predicted peroxisomal AAE. Supplementary Figure S5. Multiple protein sequence alignment of CsAAE7 and CsAAE9 with hemp Cheungsam orthologs. Green bar, AMP-binding domain. Yellow bar, AMP-binding C-terminal domain. Blue P indicates predicted peroxisomal AAE. Supplementary Figure S6. Multiple nucleotide sequence alignment of CsTKS/CsOLS with hemp Cheungsam ortholog genes. Supplementary Figure S7. Multiple sequence alignment of CsOAC with hemp Cheungsam orthologs. (A) Alignment of protein sequences of CsOAC with orthologs 115723437 and 115723438 . Green bar, stress-responsive dimeric α + β barrel (DABB) domain. (B) Alignment of nucleotide sequences.
Rights and permissions
Open Access This article is licensed under a Creative Commons Attribution 4.0 International License, which permits use, sharing, adaptation, distribution and reproduction in any medium or format, as long as you give appropriate credit to the original author(s) and the source, provide a link to the Creative Commons licence, and indicate if changes were made. The images or other third party material in this article are included in the article's Creative Commons licence, unless indicated otherwise in a credit line to the material. If material is not included in the article's Creative Commons licence and your intended use is not permitted by statutory regulation or exceeds the permitted use, you will need to obtain permission directly from the copyright holder. To view a copy of this licence, visit http://creativecommons.org/licenses/by/4.0/.
About this article
Cite this article
Sng, B.J., Jeong, Y., Leong, S. et al. Genome-wide identification of cannabinoid biosynthesis genes in non-drug type Cannabis (Cannabis sativa L.) cultivar. J Cannabis Res 6, 35 (2024). https://doi.org/10.1186/s42238-024-00246-8
Received:
Accepted:
Published:
DOI: https://doi.org/10.1186/s42238-024-00246-8

